
If you want to learn Pivot Tables in Excel, the biggest problem is not a lack of tutorials. It is the opposite. There are thousands of short videos on slicers, calculated fields and Pivot Charts, but very few of them tell you what to learn first, what to learn next and when you are actually ready to build a dashboard. So people jump around, learn ten tricks, and still feel nervous when the boss sends a messy export and asks for a report by 5 pm.
I have been teaching Excel on YouTube since 2017, and the learners who get good fastest are the ones who follow a clear sequence. In this guide I will share that sequence: a step-by-step learning path that takes you from your very first Pivot Table to an interactive, one-page KPI dashboard. You can follow it with free material, or with my full course. Either way, the order is what matters.
Why learn Pivot Tables in Excel in 2026?
Excel now has dynamic arrays, GROUPBY, PIVOTBY and Copilot, so a fair question is: are Pivot Tables still worth learning? My honest answer is yes, for three practical reasons:
- They are everywhere. Almost every company report you inherit, from sales to HR to finance, already has a Pivot Table inside it. You need to read, fix and extend them.
- They scale. With the Data Model you can build one pivot from several related tables and write DAX measures, which is the same thinking you later use in Power BI.
- They are the fastest route to a dashboard. Pivot Tables, Pivot Charts and slicers together give you an interactive report with zero formulas to maintain.
The new formula functions do not replace pivots. They sit next to them. A good analyst knows when to use each, and that comparison is part of the path below.
The Pivot Table learning path: 6 stages from zero to dashboard
Think of this as a staircase. Each stage depends on the one before it. Do not skip a step just because a later topic looks more exciting.
Stage 1: Clean data and Pivot Table basics
Before you insert a single pivot, learn what “pivot-ready” data looks like: one header row, no blank rows or merged cells, one record per row, and dates stored as real dates. Then learn the four areas of a Pivot Table: Rows, Columns, Values and Filters. Ninety percent of beginner frustration comes from dirty source data, not from the pivot itself.
You are ready to move on when you can take a raw export, clean it, and answer “total sales by region and month” in under five minutes.
Stage 2: Summarise and compare with Value Field Settings
Next, learn to change how numbers are summarised: Sum, Count, Average, Max and Min, plus number formatting inside the pivot. Then learn Show Values As: % of grand total, % of row, running total and rank. This is where Pivot Tables stop being “totals” and start giving real insight.
Stage 3: Make it interactive with sorting, filters, slicers and timelines
Now learn to control the view: sorting by values, label and value filters, Top 10 filters, grouping dates by month and quarter, and grouping numbers into bands. Then add slicers and timelines, and learn to connect one slicer to several pivots. This stage is the bridge between a report and a dashboard.
Stage 4: Calculations, layouts and Pivot Charts
Here you add calculated fields and calculated items, choose between compact, outline and tabular layouts, apply custom styles, and use conditional formatting and sparklines. Then build Pivot Charts: column, bar, line, combo and pie, all controlled by the same slicers. If you enjoy design, this is also the stage to try infographic-style charts such as progress bars and speedometers built on top of a pivot.
Stage 5: Connect real data sources and go beyond one table
Real work rarely comes in one tidy sheet. Learn to build pivots from an Excel Table, another workbook, a CSV file and even a PDF, and to combine several sheets with Power Query (append and merge). Then step up to the Data Model: one pivot from several related tables, DAX measures like CALCULATE, DIVIDE and DISTINCTCOUNT, and time intelligence for YTD, previous year and YoY %. Finally, learn to automate: unpivot cross-tab data and combine a whole folder of monthly files so the report refreshes itself.
Stage 6: Build complete projects and a dashboard
The last stage is where everything comes together. Build a sales report, an expense tracker and a multi-page interactive sales dashboard with page navigation, then finish with a one-page KPI dashboard powered only by Pivot Tables. You only truly know Pivot Tables when you can plan a dashboard, structure the data, and build it end to end without following a video click by click.
How long does it take to learn Pivot Tables?
It depends on your starting point and how much you practise, so treat these as rough guides, not promises:
| Goal | Stages | Realistic time (about 30 to 45 minutes a day) |
|---|---|---|
| Build basic summary reports | 1 to 2 | About 1 week |
| Interactive reports with slicers and charts | 1 to 4 | About 3 to 4 weeks |
| Data Model, DAX and automated reports | 1 to 5 | About 6 to 8 weeks |
| Confident dashboard builder | 1 to 6 | About 2 to 3 months |
The single biggest speed-up is practising on realistic business files instead of tiny sample tables. Watching is not learning. Building is learning.
Common mistakes when you learn Pivot Tables
- Skipping data cleaning. Blank rows, text-numbers and merged headers cause wrong totals that look right.
- Learning tricks before foundations. A fancy speedometer chart is useless if you cannot explain your Value Field Settings.
- Forgetting to refresh. Pivots do not update automatically when source data changes. Use Excel Tables as the source so new rows are included.
- Never testing yourself. If you cannot rebuild a report from a blank sheet, you have watched it, not learned it.
- Stopping at one table. The Data Model is where Pivot Tables become a real analysis tool, so do not stop at Stage 4.
Free resources to start today
If you want to try the first stages for free, my blog PK: An Excel Expert has a free chapter-by-chapter series. Start with How to Insert a Pivot Table in Excel, and when you reach the dashboard stage, read Building a Sales Dashboard in Excel with Pivot Tables, Slicers and Pivot Charts. Free tutorials are great for individual topics. What they cannot give you is a single structured path with graded practice and a final project, which is why I built the course below.
A structured Excel Pivot Table course that follows this path
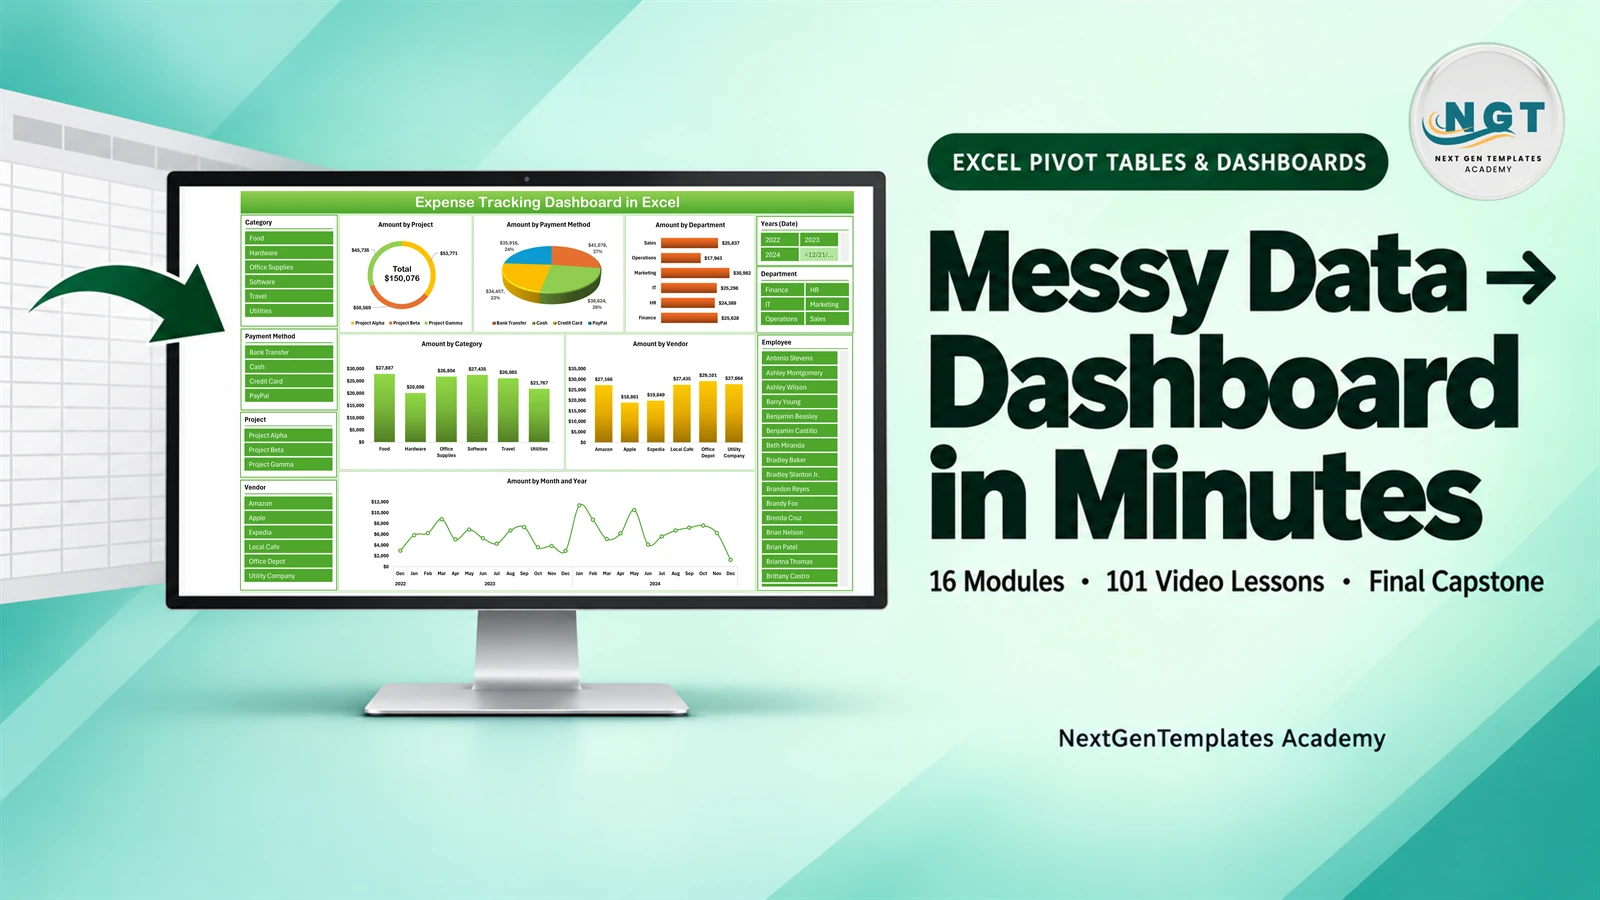
My course Excel Pivot Tables & Dashboards: Basic to Advanced on NextGenTemplates Academy follows exactly the six stages above, in the same order. Here is what is inside, straight from the course page:
- 16 modules and 132 lessons, including 101 step-by-step video lessons (11h 51m).
- 61 downloadable practice workbooks, so you build along with every lesson.
- Modules 1 to 12, 14 and 15 each end with a hands-on assessment on a realistic US business workbook with a self-marking Checks sheet, a 10-question quiz and a full solution walkthrough video.
- Module 13 is a multi-page interactive sales dashboard capstone, Module 14 covers the Data Model, relationships and DAX, and Module 15 covers Power Query automation, GROUPBY and PIVOTBY vs PivotTables, and a troubleshooting clinic for 8 common pivot errors.
- The course closes with a final capstone: a one-page Retail KPI dashboard built only with PivotTables, and a certificate of completion with a unique certificate ID.
- Works with Excel 2016 or later for Windows; Microsoft 365 is recommended for the AI, Power Query and Data Model lessons and required for GROUPBY and PIVOTBY.
NextGenTemplates Academy course
Excel Pivot Tables & Dashboards: Basic to Advanced
16 modules · 132 lessons · 61 practice workbooks · final Retail KPI dashboard capstone · lifetime access · certificate of completion.
Price: ₹2,499 in India (regular ₹3,999) · $59 internationally (regular $79). One-time payment, no subscription.
Early-bird code EARLYBIRD20 gives 20% off for the first 20 orders (one use per customer). If the code has already been fully used, checkout will simply not accept it.
Not sure where you stand today? Take the free quiz on the Test your skills page. If formulas are your weaker side, have a look at the Academy learning paths or browse all courses, including Excel + AI Mastery: 100 Essential Formulas.
Frequently asked questions
Can a complete beginner learn Pivot Tables?
Yes. You only need basic Excel navigation and simple formulas. Start with clean data and the four Pivot Table areas, and build up one stage at a time.
Which Excel version do I need to learn Pivot Tables?
Excel 2016 or later for Windows covers the core Pivot Table features. Microsoft 365 is recommended for Power Query, the Data Model and AI features, and it is required for the GROUPBY and PIVOTBY functions.
Should I learn Pivot Tables or Excel formulas first?
Learn basic formulas first (SUM, IF, simple lookups), then Pivot Tables. Pivots give quick results with less formula work, and later you can compare them with formula-based reports using GROUPBY and PIVOTBY.
Are Pivot Tables still useful now that Excel has Copilot?
Yes. AI can suggest a pivot, but you still need to know whether the summary is correct, how to fix the source data and how to turn the result into a report people trust.
Does the Excel Pivot Table course include practice files and a certificate?
Yes. Excel Pivot Tables & Dashboards: Basic to Advanced includes 61 downloadable practice workbooks and a certificate of completion with a unique certificate ID once you finish the required lessons, quizzes and assessments.
Whichever route you choose, follow the stages in order, practise on real files, and build one complete dashboard at the end. That is how Pivot Tables go from “I have seen this” to “I can do this”. Happy learning!
Priyendra Kumar (PK), founder of NextGenTemplates and creator of PK: An Excel Expert